Figure 3.2
Figure 3.3
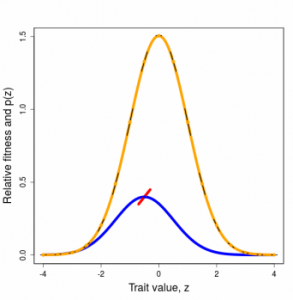
Figure 3.2 The directional selection gradient, beta, as the weighted average of first derivatives of the individual selection surface (ISS). The ISS is the orange curve; the trait distribution before selection, p(z), is shown in blue. First derivatives of the ISS are shown at regular intervals as superimposed black, straight line segments. The slopes of those segments correspond to the value of the corresponding first derivatives. The average of all those slopes, weighted by the trait distribution, is the directional selection gradient, β, shown in red at the end of the animation run. The running weighted average is shown by the changing value of the red line segment with the vertical dotted line showing the upper limit of the integration (the lower bound is minus infinity). In this animation, the ISS is a Gaussian function (with an optimum, theta, at 0 and a width parameter, omega, of 1). The trait distribution before selection is a normal distribution (with a mean of -0.5 and a variance of 1).
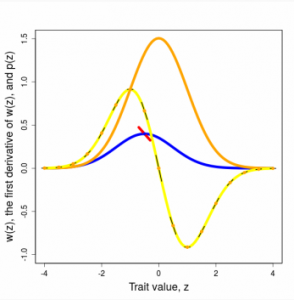
Figure 3.3 The nonlinear selection gradient, gamma, as the weighted average of second derivatives of the individual selection surface (ISS). The ISS is the orange curve; the trait distribution before selection, p(z), is shown in blue. The first derivative of the ISS is the yellow curve. First derivatives of this yellow curve (which are the second derivatives of the ISS) are shown at regular intervals as superimposed black, straight line segments. The slopes of those segments correspond to the value of the corresponding second derivatives of the ISS. The average of all those slopes, weighted by the trait distribution, is the nonlinear selection gradient, gamma, shown in red at the end of the animation run. The running weighted average is shown by the changing value of the red line segment.
The Selection Surface and Adaptive Landscape for a Single Trait
Selection on a single trait can be visualized as a curve that relates trait values to fitness, the ISS. The fundamental properties of this curve (slope and curvature) are intimately related to the changes in trait mean and variance that are induced by selection within a generation. For example, a steep selection curve dramatically shifts the mean. A ∩-shaped curve reduces trait variance within a generation. Although we generally will not know the shape of the ISS, we can deduce its properties and approximate its shape with various functions. To make predictions about how the trait will change from one generation to the next, we need a related curve, one that is averaged over the trait distribution. This curve is called the adaptive landscape (AL).
Figures 3.2 and 3.3 Directional and stabilizing selection gradients as weighted averages
Selection on a Single Trait
Selection on a Single Trait
Phenotypic selection can be measured by its effects on trait distributions within a generation. A fundamental approach in this measurement is to contrast trait distribution before and after selection. This contrast is less intuitive than the comparison of traits in survivors and nonsurvivors, but it has an important statistical advantage. The difference in trait means before and after selection is equivalent to the covariance between a trait and fitness. Such selection differentials have been measured in a wide variety of natural populations and show that trait means are usually shifted by less than a half a phenotypic standard deviation (mean about 0.6). A similar perspective on trait variances shows that they usually contract by 0-50 percent within a generation or expand by 0-25 percent as a consequence of selection.
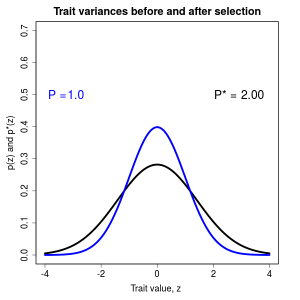
Figure 1.9 Effects of selection on a normally distributed trait
Selection on Multiple Traits
Selection on Multiple Traits
The phenotypic effect of selection on multiple traits can be assessed by its effects on multivariate trait distributions. As in the case of a single trait, the fundamental approach is to compare the first and second moments of traits distributions before and after selection. Such a multivariate comparison of moments represents a major statistical improvement over trait-by-trait comparisons. By taking a multivariate approach we may be able to identify which traits are the actual targets of selection. Analysis of selection in natural systems reveals that the effects of selection on actual targets are often obscured by correlations between traits. In addition to identifying targets of selection, multivariate analysis also gives us a way to quantify functional interactions between traits. Measuring the strength of trait interactions is especially important because most traits belong to one or more functional complexes.
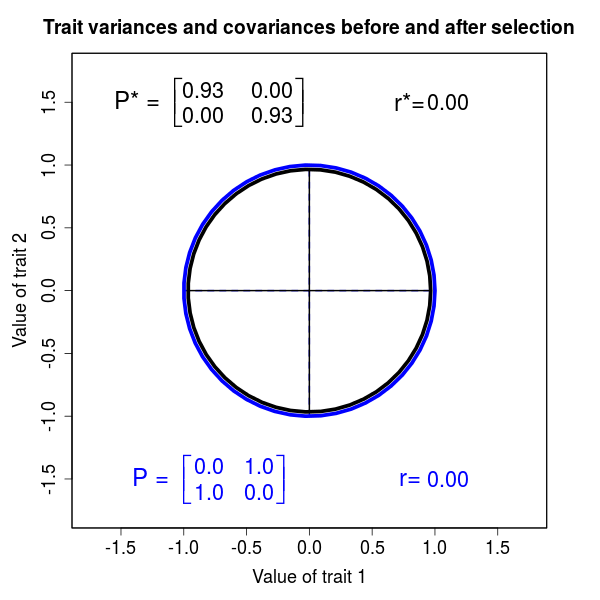
Figure 2.3 Effects of selection on a bivariate, normally distributed trait
The Selection Surface and Adaptive Landscape for a Single Trait
The Selection Surface and Adaptive Landscape for a Single Trait
Selection on a single trait can be visualized as a curve that relates trait values to fitness, the ISS. The fundamental properties of this curve (slope and curvature) are intimately related to the changes in trait mean and variance that are induced by selection within a generation. For example, a steep selection curve dramatically shifts the mean. A ∩-shaped curve reduces trait variance within a generation. Although we generally will not know the shape of the ISS, we can deduce its properties and approximate its shape with various functions. To make predictions about how the trait will change from one generation to the next, we need a related curve, one that is averaged over the trait distribution. This curve is called the adaptive landscape (AL).
Figures 3.2 and 3.3 Directional and stabilizing selection gradients as weighted averages

The Selection Surface and Adaptive Landscape for Multiple Traits
The Selection Surface and Adaptive Landscape for Multiple Traits
Selection on multiple traits can be visualized as a surface that relates fitness to the values of two or more traits in individuals. Such a surface can help us visualize the direct effects of selection on trait distributions. Indeed, under some conditions, this surface can take account of the indirect effects of selection induced by trait correlations. In the case of two traits, analysis of selection in natural populations often reveals a hill- or ridge-shaped surface that depicts bivariate stabilizing and correlational selection. The corresponding adaptive landscape has a similar shape but with less curvature.
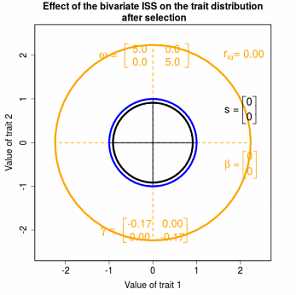
Figure 4.3 Effects of various kinds of Gaussian selection on bivariate trait distributions
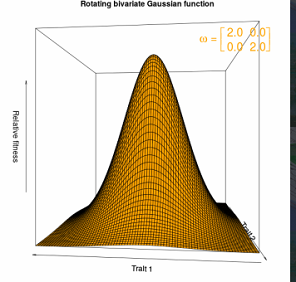
Figure 4.1 Bivariate stabilizing selection as a convex Gaussian selection surface
Inheritance of a Single Trait
Inheritance of a Single Trait
When a trait is affected by many genes, a statistical concept of inheritance can be used to predict how the effects of selection will be transmitted to the next generation. This statistical concept (genetic variance) can also be used to model the effects of selection over evolutionary time. The standing crop of genetic variation in a population can be visualized as a stable balance between the opposing effects of selection and mutation. Genetic variation is nibbled away each generation by selection, but variation is restored by mutation and other processes (recombination and migration). Studies of the mutation process reveal an appreciable per generation input to many traits. Because selection is often weak, mutation in conjunction with recombination and migration can compensate for selective losses. Consequently, the standing crop of genetic variation is substantial in most populations for many kinds of traits. The standardized genetic variance (heritability) of traits is typically in the range 0.2-0.6 (on a scale
that ranges from 0-1).
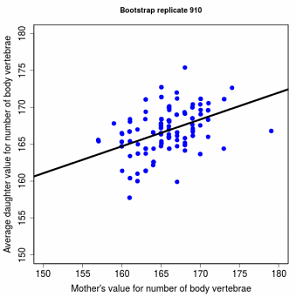
Figure 5.5 Offspring versus parent heritability plot in a garter snake
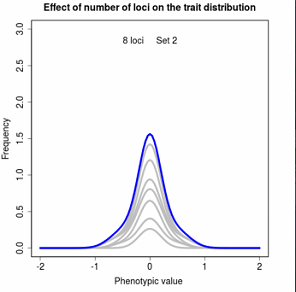
Figures 5.2 The distribution of phenotypic values as a sum of underlying genetic distributions
Inheritance of Multiple Traits
Inheritance of Multiple Traits
The G-matrix provides a useful way to model inheritance when multiple traits are affected by many genes and genetically coupled. The G-matrix is a m trait x m trait table with genetic variances on ts main diagonal and genetic covariances elsewhere. The genetic covariance between two traits summarizes genetic connections arising from linkage disequilibrium and pleiotropy. The entire G-matrix, as well as its constituent genetic variances and covariances, can be visualized as a stable balance between opposing forces. This stable equilibrium of the G-matrix represents a compromise between alternative structures imposed by the processes of selection, mutation, recombination and migration. Studies of the effects of mutation on pairs of traits often reveal pleiotropy. Studies of multiple trait inheritance often reveal appreciable genetic correlations between traits, especially when those traits are parts of a functional complex.
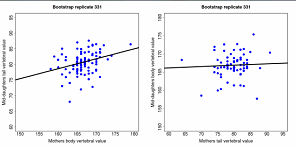
Figure 6.2 Genetic covariance estimated from offspring-parent plots in a garter snake

Drift of a Single, Neutral Trait
Drift of a Single, Neutral Trait
Random sampling of parents can cause the phenotypic mean to fluctuate from generation to generation. Such fluctuations are most severe in small populations and in the absence of selection.Theory for drift in the mean is based on a model in which many replicate populations are derived from a single ancestral population and thereafter evolve independently. Such models allow us to predict the variance among replicate trait means at any generation in the future, as a function of genetic variance and effective population size. In nature, populations diverge more rapidly in the short term than predicted by drift. In the long term, populations and species diverge less than predicted by drift.
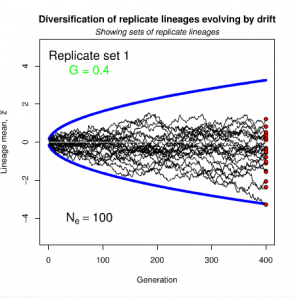
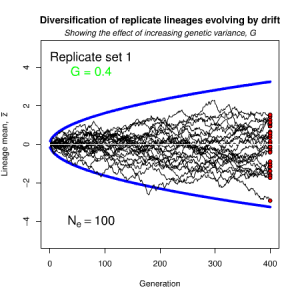
Figure 8.2 Genetic drift causes the trait mean of a lineage to undergo a random walk
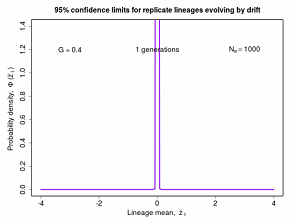
Figure 8.3 The theoretical distributions of lineage trait means under neutrality as a function of elpased time
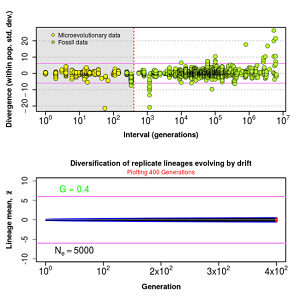
Figure 8.4 Observed divergence as a function of time (above) compared with theoretical drift expectations (below), showing that drift produces too little divergence on short timescales but too much divergence on long timescales.
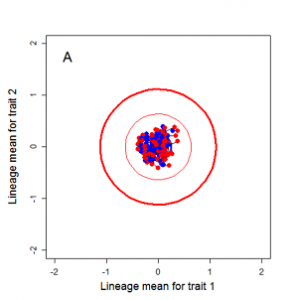
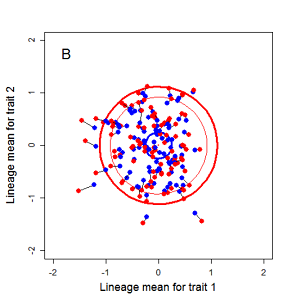
Drift of Multiple, Neutral Traits
Drift of Multiple, Neutral Traits
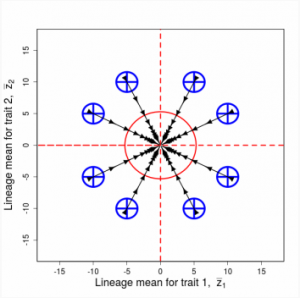
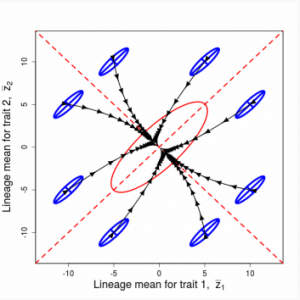
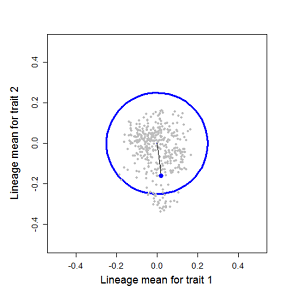
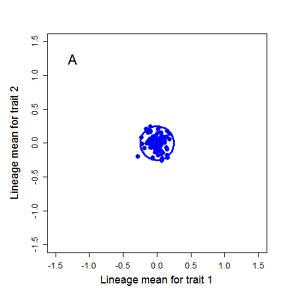
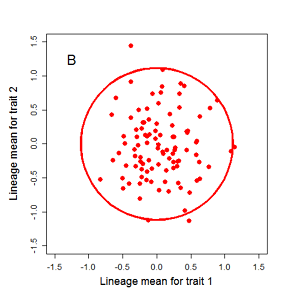
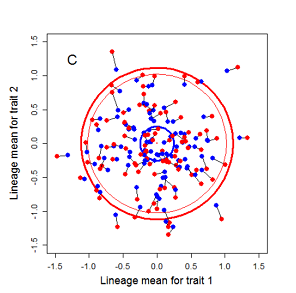
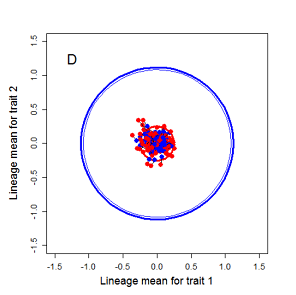
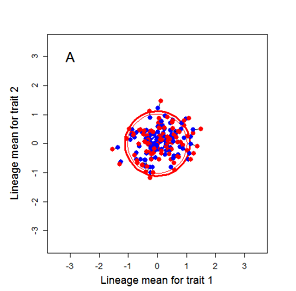
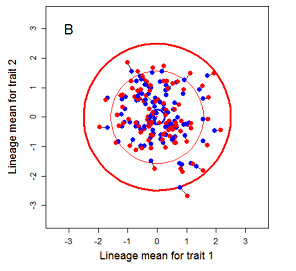
Drift of the multivariate mean is a function of elapsed time, effective population size, and the G-matrix. In the two-trait case, we can visualize the trait means of replicate populations as cloud of points in trait space. Although each mean takes an erratic path through trait space as time unfolds, the statistical behavior of the cloud is highly predictable. The cloud retains its shape and orientation, as it gradually expands in size from generation to generation. Moreover, the cloud shares its characteristic shape and orientation with the G-matrix. Tests of these predictions in natural populations reject drift as an explanation for radiation and tell us about the long term effects of selection.
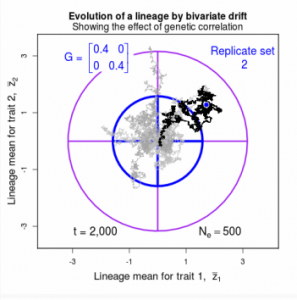
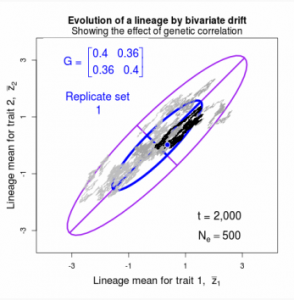
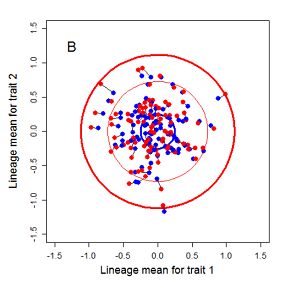
Figure 9.1 Simulations of drift in a bivariate trait
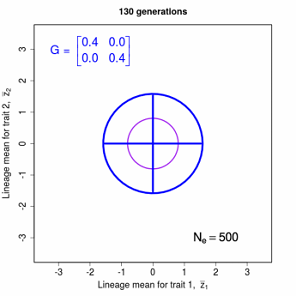
Figure 9.2 Theoretical disperson of bivariate trait means in a lineage as a function of time

Response of a Single Trait to Selection
Response of a Single Trait to Selection
The per generation response of the trait mean to directional selection is a function of genetic variance and the magnitude of selection. Experimenters have imposed deliberate selection for many generations to improve domesticated plants and animals and to gauge response in experimental lines. Steady change in the mean has often been observed for 10-120 generations, although sometimes the response is asymptotic. These observations reinforce the view that abundant genetic variation is usually available for most kinds of traits, even in small populations exposed to intense selection. The genetic underpinnings of selection response have been assessed in studies of quantitative trait loci (QTLs). One
observation is of special significance, the distribution of QTLs appears to be skewed to the left.
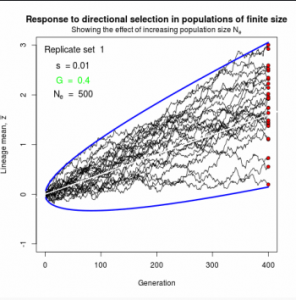
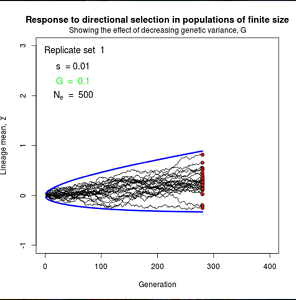
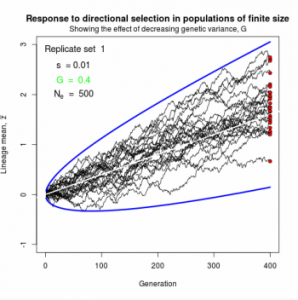
Figure 10.2 Simulated responses to selection in lineage of finite size
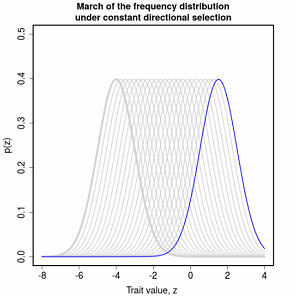
The simple “march of the trait frequency distribution”, described on page 174 but not illustrated.
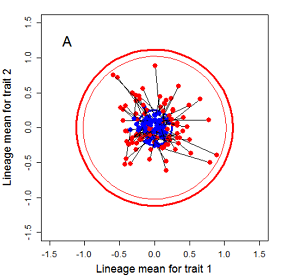
Response of Multiple Traits to Selection
Response of Multiple Traits to Selection
In the short term, multivariate response of the trait mean to directional selection is a function of the G-matrix and the vector of selection gradients, β. Directional selection on a particular trait is expected to change the mean of that trait, but selection may also induce responses in genetically correlated traits. This phenomenon is familiar to plant and animal breeders, who often observe undesirable correlated responses to selection. On evolutionary time scales genetic correlations may cause curvature in the evolutionary trajectory of the trait mean and delay the approach to a selective optimum
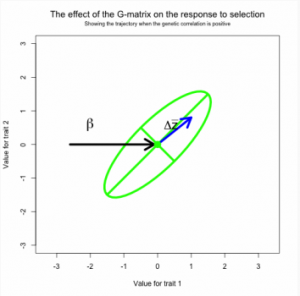
Figure 11. 2a, b, c Response to selection viewed a game of pool
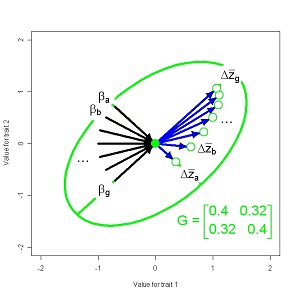
Figure 11. 2d Response to selection viewed as game of pool with a systematic pattern on shots
Evolution of a Single Trait on a Stationary Adaptive Landscape
Evolution of a Single Trait on a Stationary Adaptive Landscape
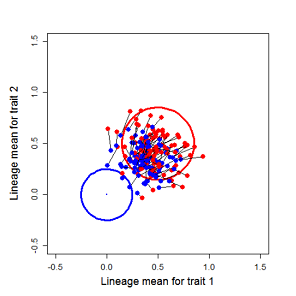
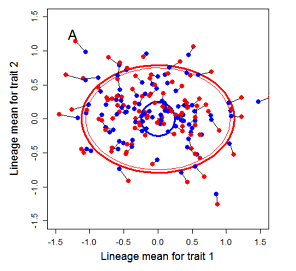
Evolution of a Single Trait on a Stationary Adaptive Landscape Overview.- The adaptive landscape is a powerful conceptual tool for modeling long-term responses to selection. In the simplest case, we imagine a set of replicate populations that descend all at once from a common ancestor and thereafter evolve on identical adaptive landscapes. As a general rule, variation among replicate means is inversely proportional to effective population size. The smaller the size of the replicates, the more variable their response to selection. A ∩-shaped adaptive landscape results in a stable equilibrium distribution of replicate means. Stabilizing selection tends to pull means towards an optimum, but that tendency is balanced by drift away from the optimum. Tests with a large data set indicate that this Ornstein-Uhlenbeck (OU) model is undoubtedly an element in the general explanationfor stasis, but other factors are also in play.
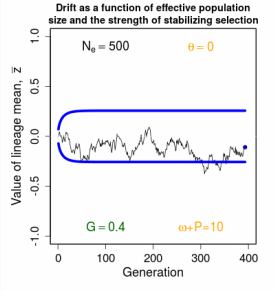
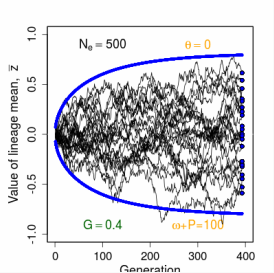
Figure 12.2 Simulations of replicate lineages evolving about a stationary intermediate optimum
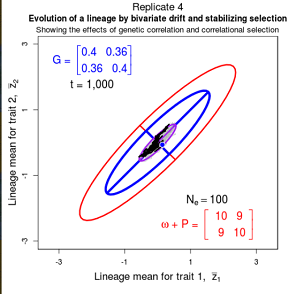
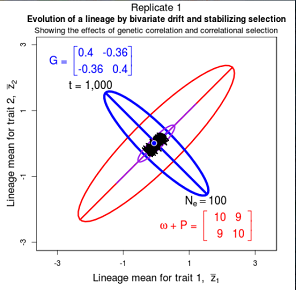
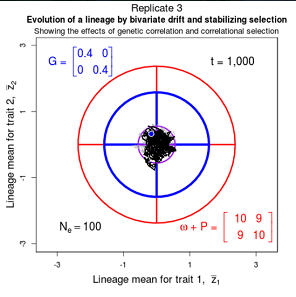
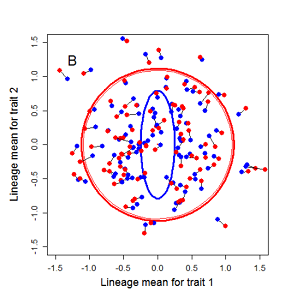
Evolution of Multiple Traits on a Stationary Adaptive Landscape
Evolution of Multiple Traits on a Stationary Adaptive Landscape
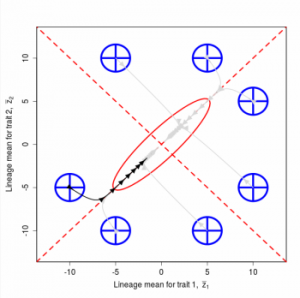
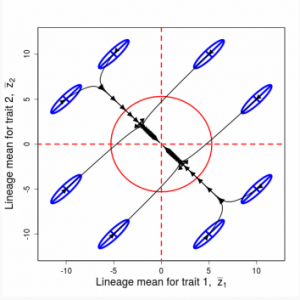
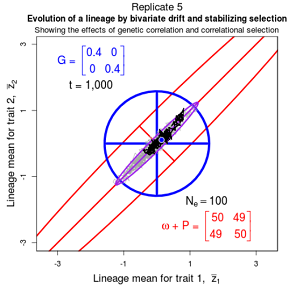
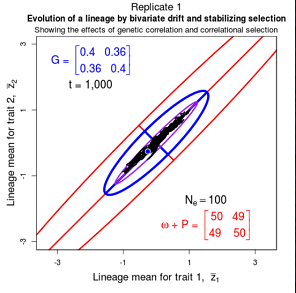
The theoretical evolution of the multivariate mean has been most explored in the case of a hill-shaped adaptive landscape that has a consistent position, shape and orientation. Under certain conditions, the mean tends to evolve uphill on this landscape, towards the adaptive peak. Theory is especially well developed for systems in which a single male trait evolves in response to sexual selection exerted by a second, female trait (sexual preference). Under these conditions, the equilibrium of the bivariate mean may be a stable point, a line or an elliptical cycle. Unstable dynamics are also possible, but probably unlikely. Finite population size adds an element of uncertainty to the outcome, changing stable points into clouds, for example. Predictions from these models are consistent with various features of populations with sexually-selected traits, but discriminating, quantitative tests have not yet been accomplished.
Random sampling of parents can cause the phenotypic mean to fluctuate from generation to generation. Such fluctuations are most severe in small populations and in the absence of selection. Theory for drift in the mean is based on a model in which many replicate populations are derived from a single ancestral population and thereafter evolve independently. Such models allow us to predict the variance among replicate trait means at any generation in the future, as a function of genetic variance and effective population size. In nature, populations diverge more rapidly in the short term than predicted by drift. In the long term, populations and species diverge less than predicted by drift.
Stevan J.Arnold
Copyright 2015
Designed & Developed by Ace Web Optimization